

Where’s that smoke coming from? How close are the fires? Will it get worse?
Various Canadian authorities provide a range of maps during wildfire season that help to answer some of these questions.
While the maps don’t replace the advice of local authorities when it comes to tackling wildfires, they do offer some insight into current conditions in the Northwest Territories, as well as what’s happened so far and what might happen next.
Here’s a guide to some useful maps and data sources. If you have more, let us know on Facebook.
All the map images on this page are examples, and don’t necessarily reflect current conditions. Click the links for up-to-date information.
Smoke forecast – click here
An example smoke forecast map is shown at the top of the page.
The tell-tale smell of smoke is one of the first things many people notice about fire season. But it can be hard to tell where that smoke is coming from, and how far away any possible source is.
FireSmoke.ca produces smoke forecasts that can tell you whether to expect smoke in the air over the next few days, how bad it might be, and where it’s coming from.
Fire danger – click here
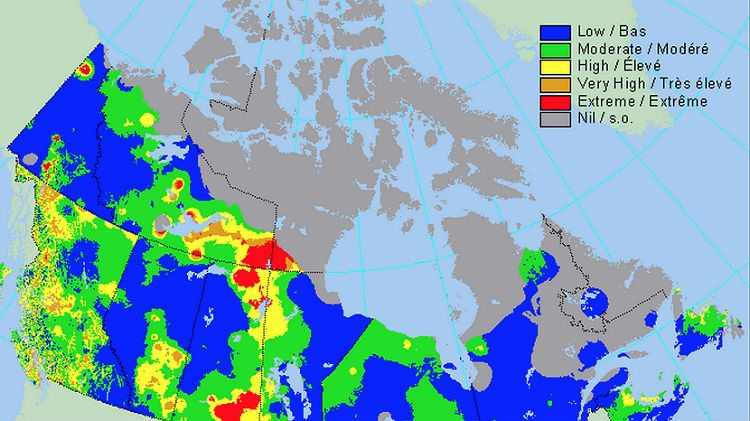
This map assesses fire danger, which is described by Natural Resources Canada as a way to gauge “how easy it is to ignite vegetation, how difficult a fire may be to control, and how much damage a fire may do” in any given area.
Blue is low-risk, yellow and brown are trouble, and red is as bad as it gets – although, to be clear, this map doesn’t measure the danger you are in; it measures the general danger of fires occurring, and the ferocity of fire to expect.
NWT fire map – click here
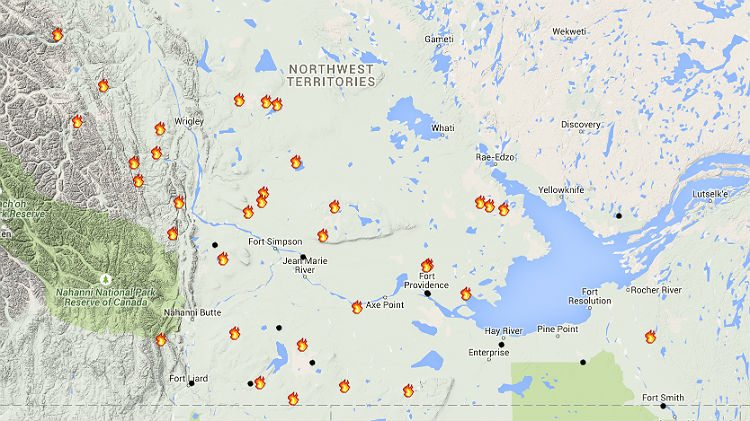
The obvious one: shows you where reported fires are currently burning in the Northwest Territories. You’ll see reporters make frequent reference to this online.
Don’t forget to use the map options to find out more – for example, you can see the locations of recent lightning strikes (which may ignite fires), plus the fire risk in each area of the territory.
You should pair this with the NWT’s wildland fire situation report, which goes into more detail about recently reported fires, actions being taken to control them, and how they were caused.
Other useful data
The hotspot report tells you how many hotspots – areas of high infrared intensity, picked up by satellite (and hence suggesting fires) – exist across Canada. This is also useful as it gives a figure for how many hectares of land have burned in each province and territory, allowing you to compare the Northwest Territories with other jurisdictions, and with last year’s figure (which, for reference, was around 3.5 million hectares in the 2014 season).
The Canadian Wildland Fire Information System has a range of other maps and data, designed primarily for professional use, which track fire behavior and forecast future developments.
The national wildland fire situation report provides you with an overall summary of fires across Canada, including a helpful weekly synopsis and a report on how each province and territory is affected. There are also graphs comparing this wildfire season with the 10-year average.


